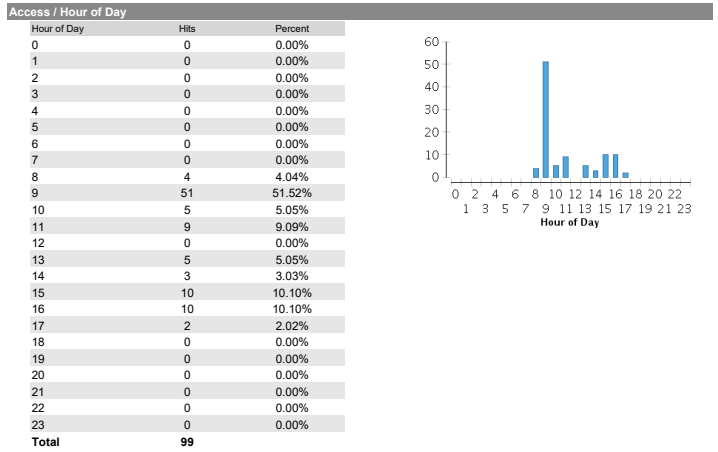
Statistics tracking can be added to most content in Blackboard. If you turn on statistics tracking, you will be able to see how many times each student has access the content on any day and get a break down of when the content is being accessed.
You have to be careful when interpreting the data.
For Blackboard Item (this is content created with the Item tool that does not need to be clicked on to view) it will trigger a view every time a student accesses the folder it is in. They do not need to click on the item for it to trigger a view. This means that items get trigged even if the student is not reading or interacting with them.
If student access the content through accessibility features in Nlackboard this may not trigger a view even if the students have viewed it.
Content will only store statistics from the point when statistics tracking is turned on.
Turning on Statistics tracking
You can tell if statistics tracking is turned on if you have edit mode turned on, you will see “Enabled: Statistics Tracking” under the content name
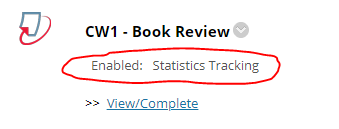
There are two ways to turn on statistics tracking
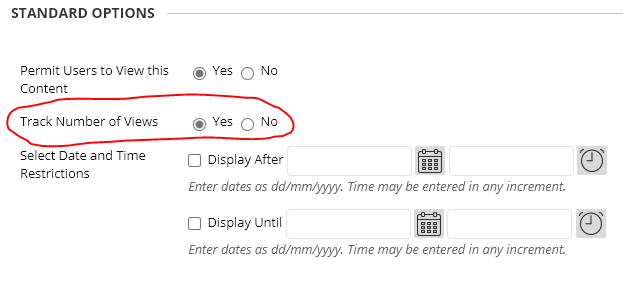
When editing the blackboard content there is an option in the standard options to track number of views. Make sure this is set to yes.
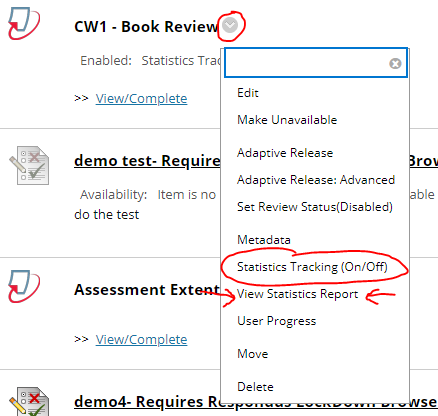
Not all content in Blackboard has the standard options, Turnitin assignments for instance. To turn on statistics tracking for these you have to click on the down arrow next to the content and chose Statistics Tracking (On/Off).
Viewing the Statistics tracking Report
To view statistics tracking reports click on the down arrow next to the content and chose View Statistics Report. This option will only be there if statistics tracking is turned on.
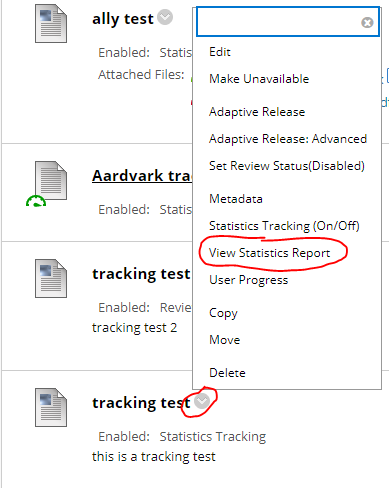
Then click on the down arrow next to the Content Usage Statistics and chose Run

You will then be asked to:
- Select a format. PDF is normally the bet option
- Select a Start Date. This is the fist day you want data for.
- Select a End Date. This is the last day you want data for.
- Select users. You can select multiple users. If you don’t select any then it will select all of them. To select more than one person use the shift or Control keys while clicking with the mouse.
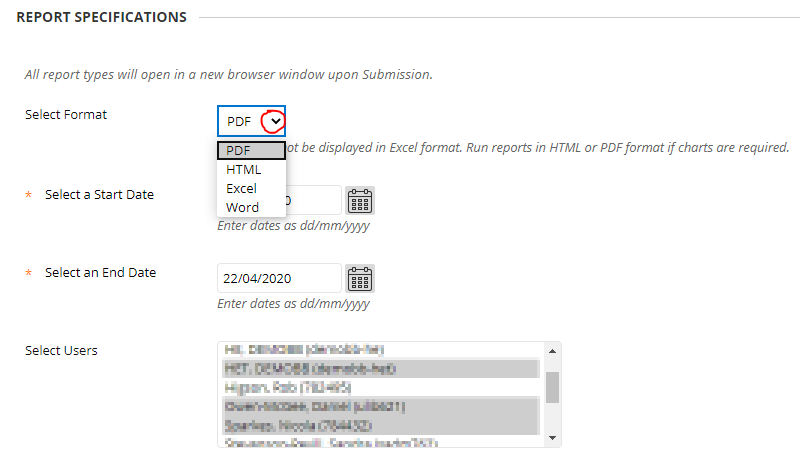
It takes a while to generate the report the shorter the date range and the fewer the number of students you include the quicker it will generate and the shorter the report will be.
Interpreting the Statistics tracking Report
At the top of the report there you get the access/ date statistics. This is a breakdown of the dates when the content has been accessed and how many times it was accessed on each day.

Below that you will get the full data for every student you chose showing how many times they access the content on each day. This is split down by month for every month covered and has totals columns.
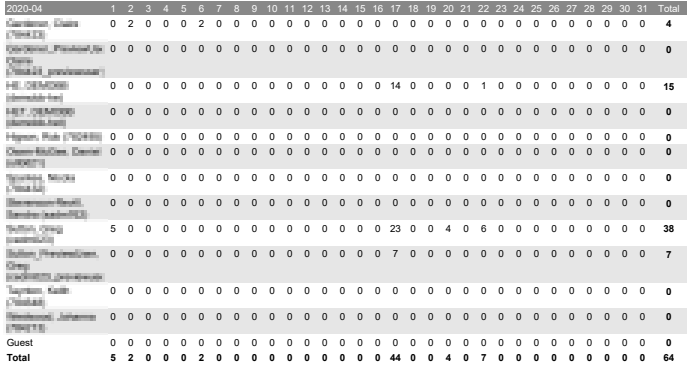
At the bottom of the report you will get breakdowns of hours of the day and days of the week when to content was accessed.
